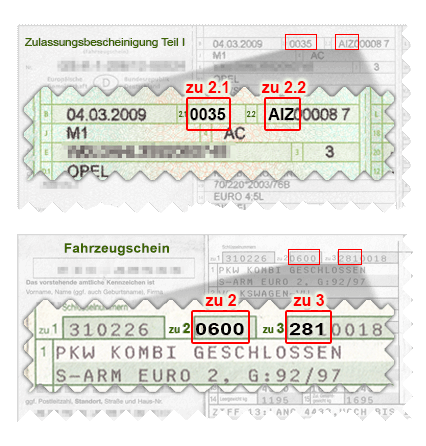
Bitte geben Sie eine KBA-Nr. ein oder wählen Sie Ihr Fahrzeug nach Kriterien aus.
KBA
Hilfe
Hersteller/Modell/Typ
Als größter deutscher Online-Shop für Autoteile wissen wir aus erster Hand, dass die Straßenqualität eine direkte Auswirkung auf die Langlebigkeit von Fahrzeugen hat. Einige Autoteile, wie u.a. Bremsscheiben, nutzen sich in Städten mit hoher Stauneigung schneller ab und Luftfilter müssen an Orten mit hoher Luftverschmutzung häufiger ausgewechselt werden.
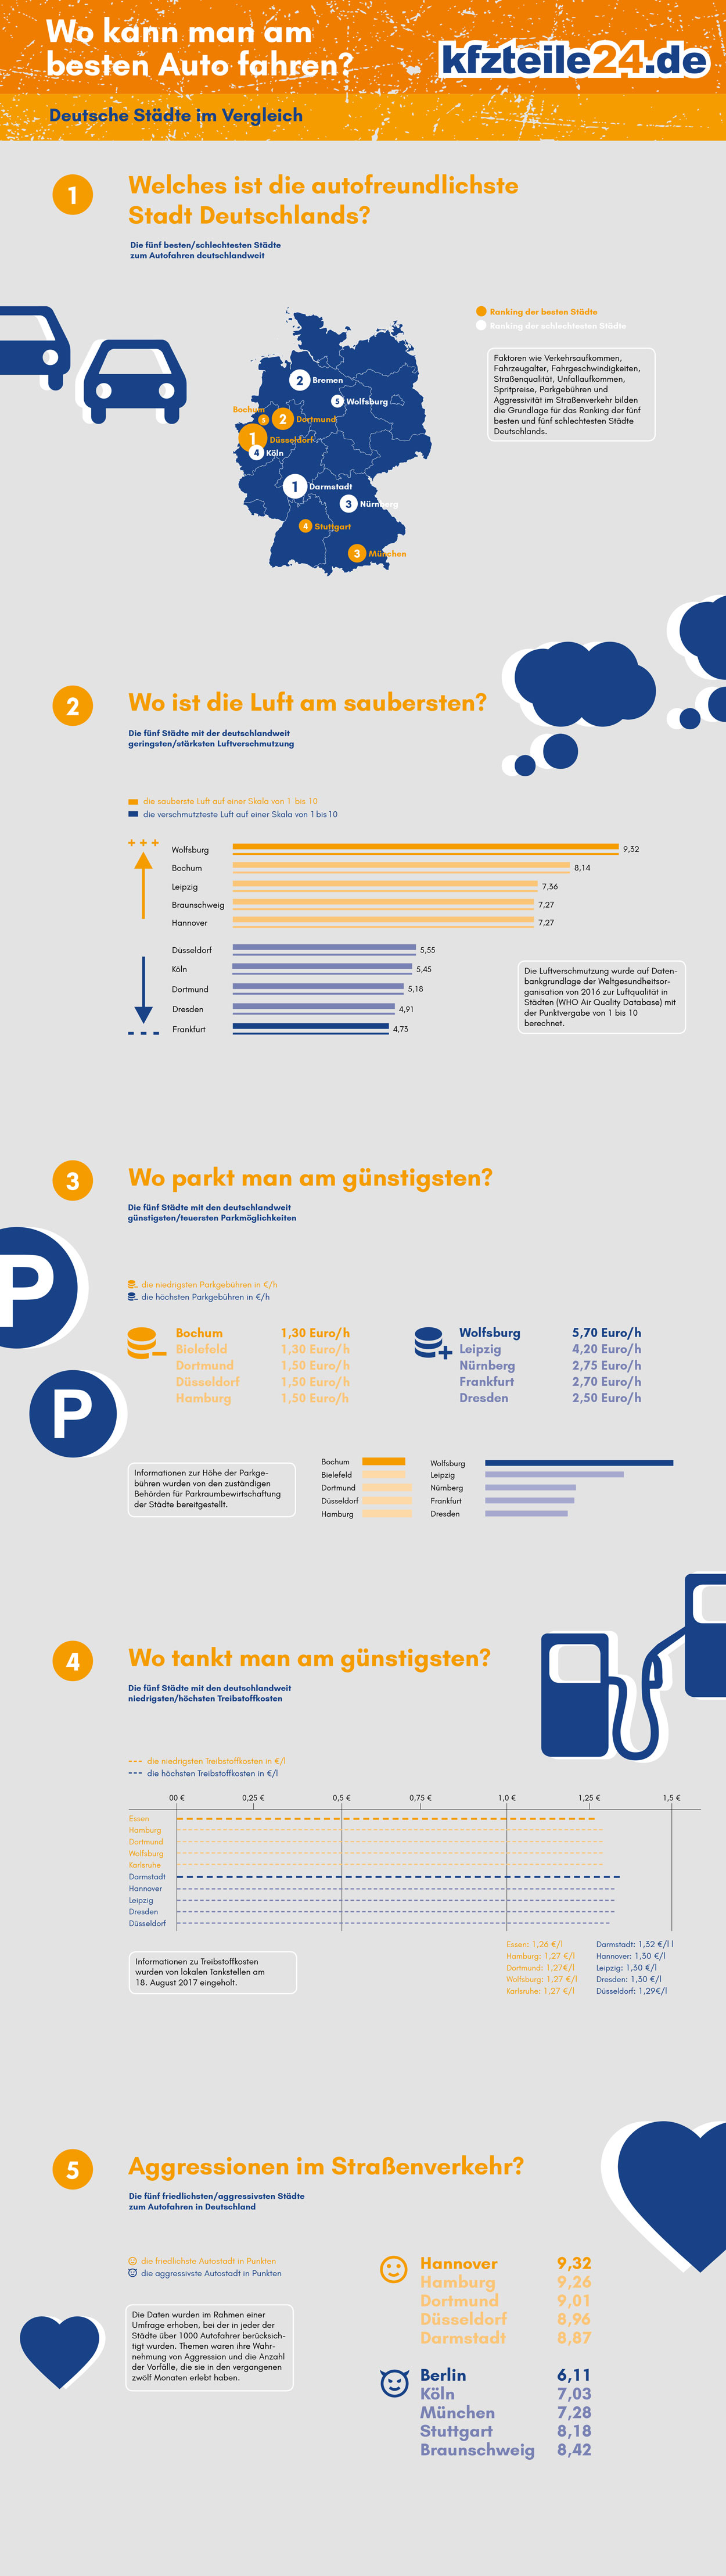
Wir haben eine weltweite Studie zur Fahrqualität in Auftrag gegeben, um herauszufinden, welches die besten und schlechtesten Städte zum Autofahren sind. Die Studie untersucht verschiedene Faktoren, unter anderem Durchschnittsalter der Fahrzeuge, Verkehrsaufkommen, Verfügbarkeit alternativer Beförderungsmittel, Parkgebühren, Treibstoffkosten, Durchschnittsgeschwindigkeit, Luftverschmutzung, Verletzte im Straßenverkehr, Straßenqualität und Aggression im Straßenverkehr. Stau und stockender Verkehr aufgrund von vorübergehenden Baustellen wurden im Rahmen dieser Studie nicht berücksichtigt. Im Anschluss an die Analyse dieser Faktoren wurde eine Gesamtpunktzahl errechnet, um zwei Ergebnistabellen zu erstellen; eine zeigt die Punktzahlen der deutschen Städte, die andere die internationalen Ergebnisse.
Autos sind ein wichtiger Bestandteil unseres modernen Lebensstils und für viele ein tägliches Fortbewegungsmittel. Dennoch können schlechte Stadtplanung und mangelhafte Verkehrsbildung das Autofahren zu einer unglaublich stressigen Erfahrung machen?, sagt Thomas Kloubert, Marketing Director von kfzteile24.de. ?Wir sind stolz darauf, dass deutsche Städte in der Studie so gut abgeschnitten haben und glauben, dass die Ergebnisse die Debatte um moderne Mobilität voranbringen können. Zudem soll die Studie Städte dazu anregen, von Positivbeispielen im Hinblick auf städtische Gesetzgebung zu lernen.?
 Verkehrsaufkommen
 Treibstoffkosten (EUR/Liter)
 Diesel (EUR/Liter)
 Alternative Beförderungsmittel (Punktzahl)
 Parkgebühren (EUR/Std)
 Durchschnittsgeschwindigkeit Flughafen - Stadtzentrum (km/h)
 Luftverschmutzung (Punktzahl)
 Aggressivität im Straßenverkehr (Punktzahl)
 Wahrnehmung der Bevölkerung
 Platzierung
| # | Stadt |

|

|

|

|

|

|

|

|
|

|

|
|---|---|---|---|---|---|---|---|---|---|---|---|---|
| 1 | Düsseldorf | 20% | 1.29 | 1.11 | 8.88 | 1.50 | 34.10 | 5.55 | 8.96 | 0.00 | 7.26 | 1 |
| 2 | Dortmund | 23% | 1.27 | 1.07 | 7.39 | 1.50 | 32.00 | 5.18 | 9.01 | 1.08 | 8.17 | 2 |
| 3 | München | 30% | 1.28 | 1.09 | 9.26 | 1.80 | 44.10 | 6.73 | 7.28 | -3.23 | 8.31 | 3 |
| 4 | Stuttgart | 28% | 1.28 | 1.08 | 8.06 | 1.80 | 40.10 | 5.73 | 8.18 | 1.08 | 8.29 | 4 |
| 5 | Bochum | 21% | 1.29 | 1.09 | 6.63 | 1.30 | 50.00 | 8.14 | 8.42 | 1.08 | 9.19 | 5 |
| 6 | Frankfurt | 28% | 1.28 | 1.08 | 7.64 | 2.70 | 33.00 | 4.73 | 8.78 | -2.15 | 8.71 | 6 |
| 7 | Essen | 28% | 1.26 | 1.07 | 5.46 | 2.25 | 32.10 | 5.91 | 8.83 | 1.08 | 7.32 | 7 |
| 8 | Hannover | 18% | 1.30 | 1.08 | 6.67 | 1.50 | 25.00 | 7.27 | 9.32 | 2.15 | 7.38 | 8 |
| 9 | Hamburg | 33% | 1.27 | 1.06 | 8.42 | 1.50 | 20.10 | 6.82 | 9.26 | -4.30 | 8.35 | 9 |
| 10 | Bielefeld | 21% | 1.28 | 1.08 | 6.15 | 1.30 | 0.00 | 7.18 | 8.69 | 1.08 | 7.09 | 10 |
| 11 | Braunschweig | 23% | 1.27 | 1.06 | 6.42 | 1.60 | 0.00 | 7.27 | 8.42 | 2.15 | 7.95 | 11 |
| 12 | Berlin | 29% | 1.27 | 1.07 | 9.84 | 1.70 | 21.00 | 5.82 | 6.11 | 2.15 | 7.32 | 12 |
| 13 | Dresden | 25% | 1.30 | 1.09 | 6.20 | 2.50 | 47.60 | 4.91 | 8.65 | 0.00 | 9.09 | 13 |
| 14 | Leipzig | 27% | 1.30 | 1.07 | 5.14 | 4.20 | 35.20 | 7.36 | 8.67 | 0.00 | 8.05 | 14 |
| 15 | Karlsruhe | 30% | 1.27 | 1.07 | 5.93 | 1.70 | 0.00 | 6.36 | 8.63 | 0.00 | 9.12 | 15 |
| 16 | Wolfsburg | 27% | 1.27 | 1.06 | 5.77 | 5.70 | 0.00 | 9.32 | 8.85 | 2.15 | 9.27 | 16 |
| 17 | Köln | 34% | 1.28 | 1.08 | 6.94 | 1.80 | 33.10 | 5.45 | 7.03 | 1.08 | 6.95 | 17 |
| 18 | Nürnberg | 21% | 1.28 | 1.17 | 5.55 | 2.75 | 21.10 | 6.00 | 8.61 | -3.23 | 9.17 | 18 |
| 19 | Bremen | 32% | 1.28 | 1.08 | 8.22 | 2.30 | 18.10 | 7.09 | 8.81 | 3.23 | 7.15 | 19 |
| 20 | Darmstadt | 21% | 1.32 | 1.22 | 6.60 | 1.70 | 0.00 | 6.36 | 8.87 | -2.15 | 8.27 | 20 |
Verkehrsaufkommen
Treibstoffkosten (EUR/Liter)
Diesel (EUR/Liter)
Alternative Beförderungsmittel (Punktzahl)
Parkgebühren (EUR/Std)
Durchschnittsgeschwindigkeit Flughafen ? Stadtzentrum (km/h)
Luftverschmutzung (Punktzahl)
 Verletzte im Straßenverkehr (Punktzahl)
 Straßenqualität (Punktzahl)
Aggressivität im Straßenverkehr (Punktzahl)
Platzierung
Straßenqualität (Punktzahl)
Aggressivität im Straßenverkehr (Punktzahl)
Platzierung
| # | Stadt | Land |
|
|
|
|
|
|
|

|

|
|
|
|---|---|---|---|---|---|---|---|---|---|---|---|---|---|
| 1 | Düsseldorf | Deutschland | 20% | 1.29 | 1.11 | 8.88 | 1.50 | 34.10 | 5.55 | 7.03 | 9.23 | 8.96 | 1 |
| 2 | Dubai | VAE | 26% | 0.41 | 0.43 | 3.81 | 3.91 | 51.00 | 8.00 | 9.13 | 8.24 | 8.65 | 2 |
| 3 | Zürich | Schweiz | 31% | 1.21 | 1.27 | 9.59 | 3.15 | 41.10 | 7.00 | 8.78 | 9.80 | 9.86 | 3 |
| 4 | Tokio | Japan | 26% | 0.97 | 0.80 | 10.00 | 3.60 | 49.00 | 4.27 | 6.94 | 8.83 | 8.45 | 4 |
| 5 | Basel | Schweiz | 27% | 1.21 | 1.27 | 9.01 | 2.20 | 28.10 | 7.64 | 10.00 | 9.80 | 9.91 | 5 |
| 6 | Singapur | Singapur | 38% | 1.22 | 0.84 | 8.56 | 1.20 | 52.10 | 3.45 | 8.69 | 10.00 | 8.25 | 6 |
| 7 | Dortmund | Deutschland | 23% | 1.27 | 1.07 | 7.39 | 1.50 | 32.00 | 5.18 | 7.03 | 9.23 | 9.01 | 7 |
| 8 | Wien | Österreich | 31% | 1.07 | 0.99 | 9.75 | 3.40 | 45.00 | 5.09 | 5.81 | 9.60 | 9.87 | 8 |
| 9 | München | Deutschland | 30% | 1.28 | 1.09 | 9.26 | 1.80 | 44.10 | 6.73 | 7.03 | 9.23 | 7.28 | 9 |
| 10 | Calgary | Kanada | 20% | 0.79 | 0.65 | 8.27 | 9.45 | 43.20 | 10.00 | 5.19 | 8.83 | 7.19 | 10 |
| 11 | Bern | Schweiz | 19% | 1.21 | 1.27 | 8.65 | 2.40 | 20.00 | 6.45 | 10.00 | 9.80 | 9.78 | 11 |
| 12 | Stuttgart | Deutschland | 28% | 1.28 | 1.08 | 8.06 | 1.80 | 40.10 | 5.73 | 7.03 | 9.23 | 8.18 | 12 |
| 13 | Montreal | Kanada | 29% | 0.79 | 0.65 | 9.01 | 6.07 | 37.00 | 8.82 | 5.19 | 8.83 | 8.81 | 13 |
| 14 | Toronto | Kanada | 30% | 0.79 | 0.65 | 8.69 | 6.75 | 41.20 | 9.18 | 5.19 | 8.83 | 8.38 | 14 |
| 15 | Helsinki | Finnland | 31% | 1.32 | 1.14 | 8.85 | 3.60 | 32.10 | 7.64 | 6.42 | 10.00 | 10.00 | 15 |
| 16 | Seattle | Vereinigte Staaten | 34% | 0.60 | 0.57 | 8.27 | 9.15 | 58.10 | 9.82 | 3.10 | 8.43 | 9.37 | 16 |
| 17 | Frankfurt | Deutschland | 28% | 1.28 | 1.08 | 7.64 | 2.70 | 33.00 | 4.73 | 7.03 | 9.23 | 8.78 | 17 |
| 18 | Amsterdam | Niederlande | 22% | 1.42 | 1.11 | 6.36 | 4.70 | 30.20 | 6.09 | 8.51 | 9.03 | 9.51 | 18 |
| 19 | Perth | Australien | 27% | 0.77 | 0.80 | 5.21 | 2.40 | 34.10 | 8.27 | 5.81 | 7.26 | 8.29 | 19 |
| 20 | Essen | Deutschland | 28% | 1.26 | 1.07 | 5.46 | 2.25 | 32.10 | 5.91 | 7.03 | 9.23 | 8.83 | 20 |
| 21 | Madrid | Spanien | 25% | 1.10 | 0.99 | 3.97 | 2.50 | 39.10 | 7.91 | 8.17 | 8.83 | 6.15 | 21 |
| 22 | Ottawa | Kanada | 28% | 0.79 | 0.65 | 7.52 | 5.74 | 29.20 | 9.91 | 5.19 | 8.83 | 8.45 | 22 |
| 23 | San Antonio | Vereinigte Staaten | 20% | 0.60 | 0.57 | 4.96 | 8.72 | 40.00 | 8.64 | 3.10 | 8.43 | 8.22 | 23 |
| 24 | Genf | Schweiz | 29% | 1.21 | 1.27 | 8.87 | 3.08 | 18.10 | 7.27 | 10.00 | 9.80 | 9.73 | 24 |
| 25 | Hamburg | Deutschland | 33% | 1.27 | 1.06 | 8.42 | 1.50 | 20.10 | 6.82 | 7.03 | 9.23 | 9.26 | 25 |
| 26 | Stockholm | Schweden | 28% | 1.33 | 1.30 | 5.88 | 7.80 | 58.20 | 5.00 | 9.65 | 8.24 | 9.33 | 26 |
| 27 | Marseille | Frankreich | 29% | 1.24 | 1.11 | 4.06 | 2.30 | 48.10 | 4.09 | 6.42 | 10.00 | 8.45 | 27 |
| 28 | Prag | Tschechien | 23% | 1.02 | 0.99 | 7.35 | 3.80 | 27.10 | 4.55 | 8.43 | 8.43 | 7.17 | 28 |
| 29 | Graz | Österreich | 29% | 1.07 | 0.99 | 6.71 | 2.60 | 26.10 | 5.36 | 5.81 | 9.60 | 9.86 | 29 |
| 30 | Rotterdam | Niederlande | 19% | 1.42 | 1.11 | 8.76 | 4.00 | 21.00 | 6.00 | 8.51 | 9.03 | 6.54 | 30 |
| 31 | Berlin | Deutschland | 29% | 1.27 | 1.07 | 9.84 | 1.70 | 21.00 | 5.82 | 7.03 | 9.23 | 6.11 | 31 |
| 32 | Barcelona | Spanien | 31% | 1.10 | 0.99 | 6.71 | 3.40 | 32.10 | 5.64 | 8.17 | 8.83 | 7.19 | 32 |
| 33 | Köln | Deutschland | 34% | 1.28 | 1.08 | 6.94 | 1.80 | 33.10 | 5.45 | 7.03 | 9.23 | 7.03 | 33 |
| 34 | Birmingham | Vereinigtes Königreich | 40% | 1.28 | 1.29 | 8.43 | 3.91 | 44.00 | 9.55 | 9.13 | 8.24 | 6.44 | 34 |
| 35 | Bremen | Deutschland | 32% | 1.28 | 1.08 | 8.22 | 2.30 | 18.10 | 7.09 | 7.03 | 9.23 | 8.81 | 35 |
| 36 | Seoul | Korea | 30% | 1.08 | 0.93 | 9.33 | 4.62 | 47.10 | 2.82 | 4.15 | 8.63 | 6.85 | 36 |
| 37 | Oslo | Norwegen | 30% | 1.56 | 1.45 | 8.09 | 5.30 | 71.00 | 6.36 | 8.08 | 4.33 | 9.48 | 37 |
| 38 | Glasgow | Vereinigtes Königreich | 30% | 1.28 | 1.29 | 5.70 | 2.30 | 27.00 | 9.36 | 9.13 | 8.24 | 4.73 | 38 |
| 39 | Bordeaux | Frankreich | 40% | 1.24 | 1.11 | 6.94 | 2.40 | 22.20 | 6.45 | 6.42 | 10.00 | 10.00 | 39 |
| 40 | Auckland | Neuseeland | 38% | 1.20 | 0.75 | 8.51 | 10.46 | 38.10 | 9.27 | 5.19 | 6.87 | 8.92 | 40 |
| 41 | Austin | Vereinigte Staaten | 25% | 0.60 | 0.57 | 5.21 | 5.23 | 26.10 | 8.18 | 3.10 | 8.43 | 7.35 | 41 |
| 42 | Toulouse | Frankreich | 29% | 1.24 | 1.11 | 4.64 | 2.70 | 21.20 | 7.36 | 7.03 | 9.23 | 7.91 | 42 |
| 43 | Philadelphia | Vereinigte Staaten | 23% | 0.60 | 0.57 | 5.30 | 14.82 | 30.10 | 7.73 | 3.10 | 8.43 | 6.00 | 43 |
| 44 | Edinburgh | Vereinigtes Königreich | 29% | 1.28 | 1.29 | 8.09 | 5.12 | 22.00 | 6.18 | 9.13 | 8.24 | 6.17 | 44 |
| 45 | Brisbane | Australien | 28% | 0.77 | 0.80 | 4.22 | 12.69 | 28.00 | 8.73 | 5.81 | 7.26 | 8.42 | 45 |
| 46 | London | Vereinigtes Königreich | 38% | 1.28 | 1.29 | 9.91 | 9.00 | 26.10 | 8.09 | 9.13 | 8.24 | 6.85 | 46 |
| 47 | Wellington | Neuseeland | 34% | 1.20 | 0.75 | 7.77 | 3.29 | 17.20 | 9.64 | 5.19 | 6.87 | 8.94 | 47 |
| 48 | Vancouver | Kanada | 39% | 0.79 | 0.65 | 8.18 | 5.06 | 24.20 | 9.73 | 5.19 | 8.83 | 5.59 | 48 |
| 49 | Liverpool | Vereinigtes Königreich | 40% | 1.28 | 1.29 | 8.60 | 5.61 | 25.10 | 6.55 | 9.13 | 8.24 | 8.42 | 49 |
| 50 | Boston | Vereinigte Staaten | 28% | 0.60 | 0.57 | 6.94 | 14.17 | 27.00 | 7.36 | 3.10 | 8.43 | 5.81 | 50 |
| 51 | Paris | Frankreich | 27% | 1.24 | 1.11 | 9.50 | 4.30 | 24.20 | 4.45 | 6.42 | 10.00 | 2.31 | 51 |
| 52 | Chicago | Vereinigte Staaten | 26% | 0.60 | 0.57 | 9.26 | 13.07 | 22.20 | 6.64 | 3.10 | 8.43 | 4.22 | 52 |
| 53 | Tallinn | Estland | 26% | 1.06 | 1.05 | 5.37 | 3.60 | 14.10 | 9.45 | 6.85 | 9.23 | 4.58 | 53 |
| 54 | Budapest | Ungarn | 22% | 1.02 | 1.01 | 2.49 | 1.60 | 27.10 | 4.00 | 4.58 | 5.10 | 7.59 | 54 |
| 55 | Melbourne | Australien | 33% | 0.77 | 0.80 | 2.98 | 13.36 | 28.20 | 7.82 | 5.81 | 7.26 | 8.78 | 55 |
| 56 | San Diego | Vereinigte Staaten | 27% | 0.60 | 0.57 | 3.56 | 8.72 | 18.10 | 9.00 | 3.10 | 8.43 | 8.13 | 56 |
| 57 | Adelaide | Australien | 27% | 0.77 | 0.80 | 1.90 | 6.10 | 19.20 | 8.36 | 5.81 | 7.26 | 9.33 | 57 |
| 58 | Lissabon | Portugal | 36% | 1.33 | 1.12 | 7.19 | 1.80 | 13.10 | 9.09 | 4.50 | 9.80 | 4.73 | 58 |
| 59 | Manchester | Vereinigtes Königreich | 29% | 1.28 | 1.29 | 9.10 | 5.08 | 23.00 | 1.36 | 3.01 | 10.00 | 7.21 | 59 |
| 60 | Tel Aviv | Israel | 39% | 1.44 | 1.32 | 5.63 | 1.48 | 35.20 | 2.64 | 8.34 | 6.47 | 3.68 | 60 |
| 61 | Sydney | Australien | 39% | 0.77 | 0.80 | 9.68 | 22.71 | 25.10 | 8.45 | 5.81 | 7.26 | 4.04 | 61 |
| 62 | Kapstadt | Südafrika | 35% | 0.82 | 0.82 | 7.19 | 0.88 | 28.10 | 2.18 | 1.09 | 6.87 | 3.70 | 62 |
| 63 | Kopenhagen | Dänemark | 32% | 1.37 | 1.15 | 5.79 | 3.80 | 26.10 | 4.82 | 4.67 | 5.50 | 9.35 | 63 |
| 64 | Kuala Lumpur | Malaysia | 43% | 0.42 | 0.40 | 2.82 | 0.91 | 49.10 | 2.73 | 1.35 | 7.84 | 4.22 | 64 |
| 65 | Miami | Vereinigte Staaten | 30% | 0.60 | 0.57 | 2.85 | 5.23 | 31.20 | 7.55 | 3.10 | 8.43 | 2.76 | 65 |
| 66 | Nizza | Frankreich | 38% | 1.24 | 1.11 | 4.64 | 4.30 | 20.00 | 4.18 | 6.42 | 10.00 | 7.91 | 66 |
| 67 | Johannesburg | Südafrika | 47% | 0.82 | 0.82 | 7.77 | 1.66 | 43.20 | 1.73 | 1.09 | 6.87 | 4.74 | 67 |
| 68 | Riga | Lettland | 23% | 0.97 | 0.86 | 2.57 | 2.50 | 29.10 | 3.55 | 4.06 | 3.54 | 5.28 | 68 |
| 69 | Dublin | Irland | 43% | 1.22 | 1.09 | 4.47 | 2.75 | 15.20 | 8.91 | 7.99 | 7.84 | 6.65 | 69 |
| 70 | New York | Vereinigte Staaten | 35% | 0.60 | 0.57 | 9.42 | 23.80 | 18.10 | 8.55 | 3.10 | 8.43 | 2.58 | 70 |
| 71 | Antwerpen | Belgien | 30% | 1.25 | 1.15 | 3.48 | 2.45 | 16.10 | 4.64 | 4.76 | 8.04 | 7.48 | 71 |
| 72 | Brüssel | Belgien | 38% | 1.25 | 1.15 | 2.82 | 2.90 | 23.20 | 5.27 | 4.76 | 8.04 | 7.71 | 72 |
| 73 | Athen | Griechenland | 36% | 1.39 | 1.16 | 6.04 | 5.70 | 57.10 | 3.18 | 1.96 | 9.60 | 3.14 | 73 |
| 74 | Santiago de Chile | Chile | 43% | 0.96 | 0.62 | 2.08 | 2.36 | 36.00 | 2.00 | 2.83 | 8.24 | 4.55 | 74 |
| 75 | Mailand | Italien | 27% | 1.39 | 1.25 | 1.99 | 5.20 | 56.10 | 3.27 | 4.93 | 5.70 | 4.19 | 75 |
| 76 | Los Angeles | Vereinigte Staaten | 45% | 0.60 | 0.57 | 4.22 | 8.72 | 33.00 | 7.27 | 3.10 | 8.43 | 3.68 | 76 |
| 77 | Peking | China | 46% | 0.81 | 0.71 | 1.83 | 1.29 | 36.10 | 1.64 | 1.96 | 5.90 | 6.26 | 77 |
| 78 | Shanghai | China | 48% | 0.81 | 0.71 | 2.24 | 1.41 | 56.20 | 1.82 | 2.31 | 2.37 | 7.17 | 78 |
| 79 | Rom | Italien | 35% | 1.39 | 1.25 | 3.30 | 4.20 | 36.00 | 4.36 | 4.93 | 5.70 | 3.52 | 79 |
| 80 | Buenos Aires | Argentinien | 42% | 1.11 | 0.97 | 4.96 | 1.73 | 41.20 | 4.91 | 2.75 | 3.16 | 1.92 | 80 |
| 81 | Sofia | Bulgarien | 29% | 0.94 | 0.92 | 2.66 | 1.02 | 21.20 | 2.91 | 4.41 | 2.17 | 3.02 | 81 |
| 82 | Hongkong | China | 41% | 1.65 | 1.29 | 3.30 | 2.74 | 63.10 | 2.45 | 1.96 | 5.90 | 5.09 | 82 |
| 83 | Warschau | Polen | 37% | 0.98 | 0.94 | 3.81 | 1.00 | 17.00 | 3.64 | 3.97 | 2.37 | 4.01 | 83 |
| 84 | Moskau | Russland | 41% | 0.60 | 0.55 | 4.96 | 2.88 | 29.20 | 3.73 | 1.79 | 1.77 | 2.12 | 84 |
| 85 | Bangkok | Thailand | 61% | 0.83 | 0.62 | 2.91 | 1.16 | 34.10 | 3.00 | 1.00 | 7.07 | 3.54 | 85 |
| 86 | St. Petersburg | Russland | 44% | 0.60 | 0.55 | 6.04 | 2.88 | 28.00 | 3.73 | 1.79 | 1.77 | 1.00 | 86 |
| 87 | Jakarta | Indonesien | 58% | 0.54 | 0.58 | 1.09 | 0.33 | 28.10 | 2.09 | 2.66 | 3.93 | 3.68 | 87 |
| 88 | Bukarest | Rumänien | 50% | 0.94 | 0.94 | 2.31 | 0.49 | 26.00 | 3.91 | 4.32 | 1.00 | 3.99 | 88 |
| 89 | Sao Paulo | Brasilien | 30% | 1.00 | 0.82 | 3.20 | 5.35 | 24.10 | 3.36 | 1.44 | 2.57 | 4.06 | 89 |
| 90 | Rio de Janeiro | Brasilien | 37% | 1.00 | 0.82 | 3.56 | 3.56 | 20.10 | 2.55 | 1.44 | 2.57 | 4.51 | 90 |
| 91 | Istanbul | Türkei | 49% | 1.25 | 1.10 | 1.56 | 1.46 | 19.00 | 2.27 | 4.23 | 6.87 | 1.49 | 91 |
| 92 | Mexiko Stadt | Mexiko | 66% | 0.78 | 0.74 | 5.46 | 6.01 | 28.10 | 3.09 | 2.92 | 6.09 | 4.62 | 92 |
| 93 | Bogota | Kolumbien | 48% | 0.64 | 0.59 | 1.56 | 4.50 | 20.10 | 2.36 | 4.93 | 4.53 | 1.22 | 93 |
| 94 | Ho Chi Minh Stadt | Vietnam | 64% | 0.67 | 0.52 | 1.16 | 0.95 | 24.00 | 1.91 | 1.26 | 2.57 | 5.77 | 94 |
| 95 | Bangalore | Indien | 64% | 0.95 | 0.79 | 1.32 | 0.74 | 30.10 | 1.45 | 2.40 | 4.13 | 1.94 | 95 |
| 96 | Mumbai | Indien | 67% | 0.95 | 0.79 | 6.04 | 0.82 | 13.10 | 1.55 | 2.40 | 4.13 | 3.20 | 96 |
| 97 | Ulaanbaatar | Mongolei | 65% | 0.54 | 0.58 | 1.00 | 1.72 | 35.10 | 1.18 | 1.61 | 1.20 | 4.19 | 97 |
| 98 | Lagos | Nigeria | 60% | 0.39 | 0.55 | 1.25 | 0.28 | 17.20 | 1.00 | 1.70 | 2.76 | 3.50 | 98 |
| 99 | Karachi | Pakistan | 59% | 0.56 | 0.63 | 1.38 | 0.48 | 18.10 | 1.09 | 2.22 | 3.54 | 1.81 | 99 |
| 100 | Kolkata | Indien | 69% | 0.95 | 0.79 | 1.41 | 0.27 | 18.00 | 1.27 | 2.40 | 4.13 | 4.24 | 100 |
Um die 50 besten und schlechtesten Städte zum Autofahren zu ermitteln, haben wir zunächst die 500 Städte mit der höchsten Anzahl registrierter Fahrzeuge untersucht. Anschließend haben wir geprüft, für welche Städte am meisten Verkehrsdaten zur Verfügung standen und uns auf eine Liste von 100 Städten festgelegt.
Um die Fahrqualität in den einzelnen Städten messbar zu machen und einen Vergleich zu ermöglichen, haben wir die Daten in drei Stufen evaluiert. Als erstes haben wir ein Ranking der Rohdaten vom höchsten zum niedrigsten Wert erstellt. Auf Grundlage dieses Rankings haben wir mit der folgenden Formel eine Standardpunktzahl errechnet:
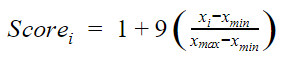
Eine niedrige Punktzahl beschreibt eine schlechte Fahrqualität in der entsprechenden Kategorie. Je höher der Wert ist, desto besser ist die Stadt zum Autofahren geeignet. Die Ziffer 1 steht für die schlechtmöglichsten Bedingungen, 10 hingegen für die besten. Im zweiten Schritt haben wir allen Kategorien eine Prozentzahl zugeordnet. Um eine abschließende Rangfolge zu erstellen, wurde eine Gesamtpunktzahl als gewichteter Durchschnitt jeder einzelnen Kategorie errechnet:
Gesamtpunktzahl (i) = 30% Verkehrsaufkommen (i) + 15% Alternative Beförderungsmittel (i) + 10% Parkgebühren (i) +15% Durchschnittsgeschwindigkeit (i) + 5% Luftverschmutzung (i) +
+5% Treibstoffkosten (i) + 10% Verletzte im Straßenverkehr (i) + 5% Straßenqualität (i) + 5% Aggression im Straßenverkehr (i)
Im dritten und letzten Schritt haben wir die Daten standardisiert, um eine abschließende Gesamtpunktzahl zu erhalten. Es ist anzumerken, dass wir für das Verkehrsaufkommen die tatsächliche Prozentzahl und für den Preis von Benzin und Diesel den tatsächlichen Preis verwendet und keine Standardisierung vorgenommen haben.
Die Studie untersucht verschiedene wesentliche Faktoren, um die Fahrqualität in den 100 Städten zu ermitteln: Verkehrsaufkommen, Verfügbarkeit alternativer Beförderungsmittel, Parkgebühren, Treibstoffkosten, Luftverschmutzung, Durchschnittsgeschwindigkeit zwischen dem Stadtzentrum und dem internationalen Flughafen, Verletzte im Straßenverkehr, Straßenqualität und Aggression im Straßenverkehr. Bei den Ergebnissen für Deutschland haben wir zusätzlich das Durchschnittsalter der Fahrzeuge untersucht, um eine eventuelle Korrelation zwischen der Fahrqualität und der Langlebigkeit von Fahrzeugen feststellen zu können.
Verkehrsaufkommen: Für das Verkehrsaufkommen wurden größtenteils Daten des Verkehrs-Index von TomTom herangezogen. Für Städte, die nicht in diesem Index aufgeführt sind, wurden Daten von den Stadtverwaltungen der entsprechenden Städte bereitgestellt. Stau und stockender Verkehr aufgrund von vorübergehenden Baustellen wurden im Rahmen dieser Studie nicht berücksichtigt.
Alternative Beförderungsmittel: Die Verfügbarkeit alternativer Beförderungsmittel beeinflusst die Fahrqualität in einer Stadt, da Menschen gezwungen sind, Auto zu fahren, wenn öffentliche Verkehrsmittel nicht in ausreichendem Maß vorhanden sind. Dies führt zu vermehrter Staubildung, schnellerer Verschlechterung der Straßenqualität und häufigeren Aggressionen im Straßenverkehr. Außerdem führt ein Mangel an Alternativen dazu, dass ältere Menschen weiterhin Auto fahren müssen, obwohl es für sie gefährlich sein kann. Die Punktzahl basiert auf der Länge des Bahnnetzes pro Kopf, Daten wurden von Systembetreibern bezogen.
Parkgebühren: Die Punktzahl wurde anhand der Parkkosten für eine Stunde berechnet. Informationen wurden von den zuständigen Behörden für Parkraumbewirtschaftung bereitgestellt.
Durchschnittsgeschwindigkeit: Die Punktzahl basiert auf der durchschnittlichen Geschwindigkeit zwischen Stadtzentrum und internationalem Flughafen, berechnet aus Werten zu drei Tageszeiten (morgens, mittags, abends).
Luftverschmutzung: Die Bewertung basiert auf der WHO-Datenbank zur Luftqualität in Städten von 2016.
Treibstoffkosten: Die Werte wurden am 18. August 2017 von lokalen Tankstellen erhoben.
Verletzte im Straßenverkehr: Die WHO-Studie ?Global Status Report on Road Safety 2013? diente als Grundlage zur Berechnung der Punktzahl.
Straßenqualität: Die Bewertung basiert auf dem ?Travel & Tourism Competitiveness Report 2013? des Weltwirtschaftsforums, das Bürger nach ihrer Wahrnehmung befragt hat.
Aggression im Straßenverkehr: Über 1000 Autofahrer pro Stadt wurden zu ihrer Wahrnehmung und ihren Erfahrungen mit aggressivem Verhalten im Verkehr befragt.
Fahrzeugalter: Nur für deutsche Städte: Die Abweichung vom bundesweiten Durchschnitt wurde mit Daten des Verkehrsministeriums berechnet. 0,00 entspricht dem Durchschnitt; negative Werte deuten auf langlebigere Fahrzeuge hin, positive auf kürzere Lebensdauer.